The wine industry in Georgia has experienced strong growth over the past decade in all key indicators such as exports, turnover, and employment and salaries (measured both in GEL and in USD). The financials of the sector have also looked impressive during this time.

Macroeconomic Indicators
Georgian wine exports have been somewhat resilient to the COVID-19 pandemic, as in 2020 Georgia exported 91.7 mln bottles of wine, which is 98.1% of the amount exported in 2019. In 6M2021, exports of wine increased by 14.6% compared to 6M2019 (46.4 mln bottles in 2021, compared to 40.5 mln bottles in 2019).
Wine comprised 8.2% of the country’s total exports and was the 3rd most exported commodity (after copper ores and ferro-alloys) in 2019. Wine exports grew by an impressive 19.5% Compound Annual Growth Rate (CAGR) over the period of 2011-2019. The most significant year-on-year increase was recorded in 2017, when exports grew by 54.4% compared to 2016.
The average price of exported wine over the period of 2011-2020 was US$2.46 per bottle. From 2012 to 2014, the price increased significantly from $2.41 to $2.95, however it sharply fell to $2.26 in 2016. Over the period of 2016-2020, the price stabilized between $2.2 and $2.4. For a global comparison, the world average export price for wine in 2019 was $2.59 per bottle, slightly higher than the $2.38 in Georgia in that year. During 2011-2016, Georgian wine was more expensive than world average, while since 2016, the opposite is true.

Georgian wine industry is highly dependent on exports to Russia, which took in an average of 57.5% of the total exports in 2016-2020. This makes the sector susceptible to shocks from related to political factors/changes, such as the embargo imposed by Russia on Georgian wine during 2006-2013.
Other key markets for Georgian wine include Ukraine (average share over 2016-2020 – 12%), the European Union (9.2%), China (7.7%), Kazakhstan (4.3%), and Belarus (2.9%). 48.1% of exports to the European Union over the covered period were attributed to Poland, followed by the three Baltic states (37.2%).
Total turnover(1) of the wine production sector measured in GEL has seen tremendous growth over the past decade, and by 2019 it had doubled since 2016 and quadrupled since 2011. The annual average growth of turnover in the sector stood at a massive 27.9% over the period of 2011-2019 in GEL, and 20.0% in USD. The role of the sector in the whole economy, as measured by the share of its turnover to total turnover, amounted to 0.8% in each year between 2017 and 2019.
The output of the wine production sector, as well as its value-added, share similar dynamics to its turnover. The CAGR of output over 2011-2019 amounted to 28.8% (20.8% in USD), while the value-added increased by 24.7% annually on average (17.0% in USD) over the same period. In 2019, the wine sector’s output was 2% of the output of the total economy. Investments in fixed assets by the wine sector also reflect similar dynamics to the abovementioned indicators, albeit with a notable distinction – in 2018 and 2019, investments increased by 65% and 62%, respectively, amounting to 1.9% of Georgia’s investment in fixed capital in 2019. Overall, the investments in this sector recorded an average annual growth rate of 32.4% in 2011-2019 (24.2% in USD).

The wine production sector in Georgia employed on average 0.8% of employed people (approximately 5 000 people) in Georgia in 2011-20192. For number of employees in the sector, a CAGR of 12.1% was reported. In 2019, the average monthly remuneration of workers in the wine production sector amounted to GEL 1 046, and this figure had been increasing by 11.5% annually on average over the period of 2011-2019. The average salary in the wine production sector compared to the average salary in Georgia has been increasing significantly – from 79% in 2014 to 93% in 2019. The productivity of the sector (i.e. output per employee) increasing at a CAGR of 14.9% in 2011-2019 (7.7% when output is measured in USD).
Financial Indicators
In addition to analyzing the sector’s key indicators, it is interesting to observe the financial performance of the sector. The data necessary for the conducting of financial analysis have been provided by EBIT Group, a financial consulting company. EBIT Group processed the financial statements of Georgian companies and conducted an analysis which is available on the investment-analytical platform ebita.ge.
By aggregating financial statements of 50 companies, we can draw insights on the sector’s profitability, liquidity, leverage, and asset management.
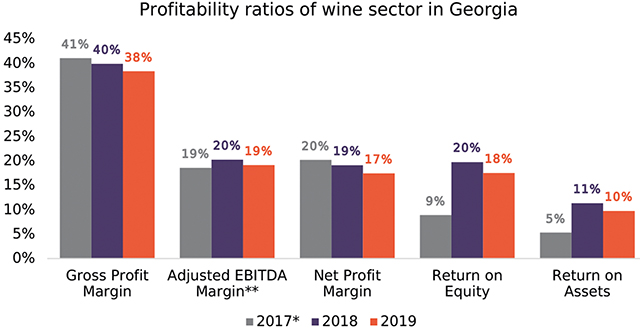
Looking at five different profitability ratios, it seems that the wine production sector in Georgia is relatively profitable, however, over the course of 2017-2019 some of its profitability ratios were characterized by a slightly downward trend.
Nevertheless, if we benchmark Georgia’s wine industry’s ratios against winemakers in the United States3, both net profit margin and return on equity are significantly higher for Georgian companies.

The industry has a sound leverage ratio, with the debt-to-equity ratio amounting to 0.81 in 2019.
However, this represented a 20-percentage point increase compared to 2017 and a 4-percentage point increase compared to 2018.
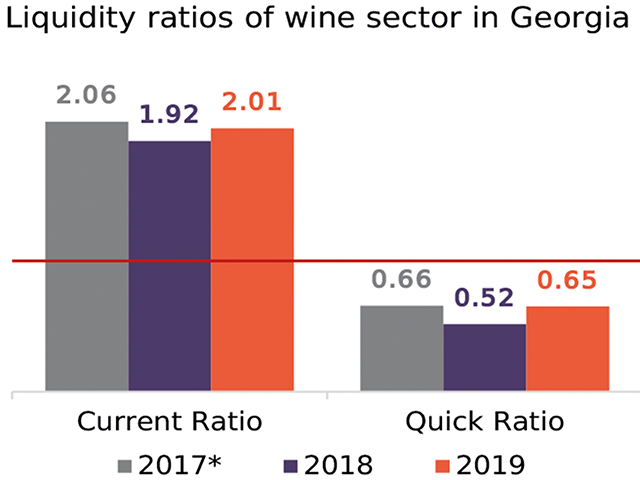
The liquidity of the sector, as measured by the current ratio, was equal to 1.72 in 2019, which is considered adequate. However, the quick ratio in 2019 amounted to 0.51. The stark difference between these two ratios highlights the importance of inventories for the sector. Indeed, the inventories accounted for 31% of total assets of the analyzed companies in 2019.

In terms of asset management, the industry has some issues regarding excess inventories, as its inventory turnover ratio amounted to 0.9 in 2019. For the sake of comparison, the corresponding figure for United States wineries3 was 2.69. Moreover, the inventory turnover in days was equal to 386 days, pushing the cash conversion cycle to 390 days, meaning that it takes more than one year for firms to convert their expenditure into cash.

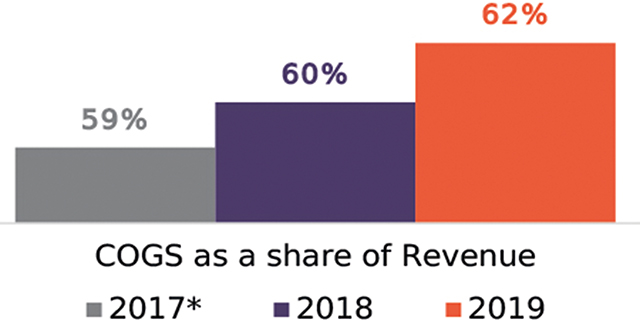
Vertical analysis of the industry’s income statement reveals that its cost of goods sold (COGS) as a share of its revenues increased over the 2017-2019 period, from 59% in 2017, to 62% in 2019. In addition to this increase in COGS, interest expenses as a share of revenues also rose over the analyzed period (from 3.3% in 2017, to 2.9% in 2018, and then 3.8% in 2019).


1 In this section we analyze key indicators of the wine production sector, based on the data gleaned from the Statistical Survey of Enterprises by the National Statistics Office of Georgia. It should be mentioned here that as of June 2021, there were 693 companies registered as wine producers in Georgia. Presented data is based on NACE rev 2 classification. The analyzed code is 11.02.
2 This number includes only employees of wine producer firms. It does not involve people employed in wineyards or farmers who grow their own wineyards.
3 http://www.bizstats.com/corporation-industry-financials/manufacturing-31/wineries-312135/show
* In 2017, the sample of companies included in the analysis is significantly lower than in 2018 and 2019.
** In 2017, Adjusted EBITDA margin is higher than Net Profit Margin, which is mainly attributed to high non-operating income of some companies in the sample.
![]()


