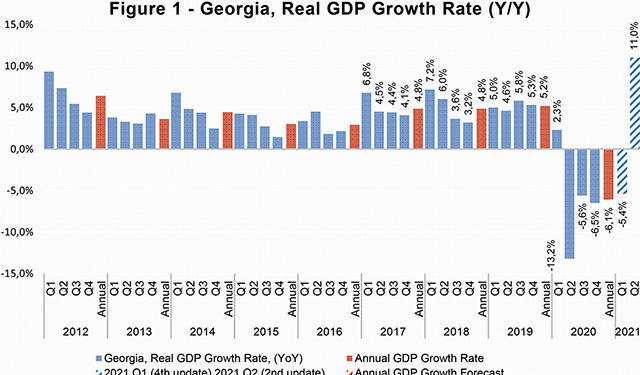
ISET-PI has updated its real GDP growth forecast for the first and second quarters of 2021. Here are the highlights of this month’s release:
HIGHLIGHTS
• The real GDP growth rate amounted to -11.5% year-on-year for January 2021.
• As a result of the update, the growth forecast for Q1 of 2021 remained unchanged, at -5.4%. ISET-PI’s second forecast for Q2 of 2021 puts GDP growth at positive 11%.
• Since Q2 2021, the growth rate is relative to the same quarter of the previous year, the unusually high 11% growth rate is in part due to the pandemic-driven collapse of GDP observed in Q2 2020 (negative 13.2%). Thus, our forecast model “expects” the bounce back recovery of real GDP relative to last year.
• The negative 5.4% growth projected in Q1 2020 is possibly too “optimistic”, as most of the lockdown measures were extended until mid-March.
• Based on January data, the annual growth in 2021, is expected to be 2.5% in the worst-case scenario, and 3.6% in the best-case or an average long-term growth scenario. Our middle-of-the-road scenario (based on the average growth in the last four quarters) predicts a 2.9% increase in real GDP.
• Overall, the projected growth numbers for Q1 and Q2 2021 should be interpreted with caution, as our model does not take into account the current and potential future public health measures to contain the pandemic, significant uncertainties associated with the pace of vaccination and the economic rebound after the lockdown.
Forecasts of the real GDP growth.
ISET-PI’s forecast is a little bit more pessimistic than the forecast of the National Bank of Georgia (NBG) and International Organizations (ADB, IMF, and World Bank). According to the recent Monetary Policy Report of NBG (February 2021), real GDP will increase by around 4% in 2021. This forecast assumes that with an improving epidemiological situation, the tourism sector will gradually begin to recover in the second half of the year. According to the Asian Development Bank’s (ADB) recent Economic Outlook (September 2020), Georgia’s economy is expected to expand by 4.5% this year.
Similarly, the International Monetary Fund (IMF) (January 2021) predicts a 4.3% growth rate. The World Bank (WB) (January 2021) has one of the most conservative predictions among international (and even national) organizations. According to the WB, the economy is projected to increase by 4% in 2021.
GDP growth by Categories of Use.
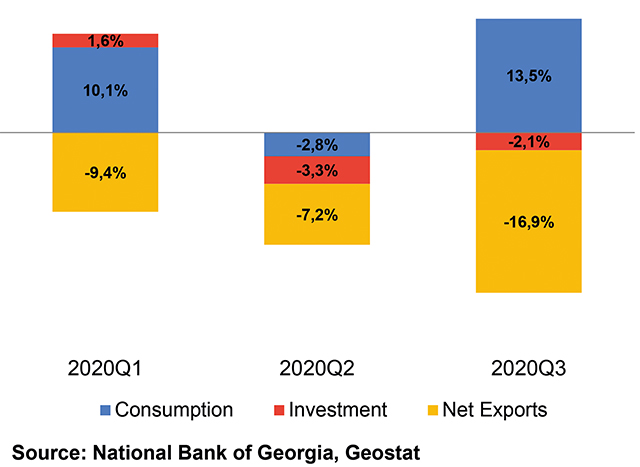
Geostat has released information about the decomposition of economic growth by categories of use for the first three quarters of 2020. Increase in consumption expenditure (both public and private) was the main positive contributor to real GDP in the first and third quarters of 2020. One may note that overall, GDP growth was -5.6% in Q3, but the collapse would have been more dramatic without the increase in consumption expenditure. The boost to overall consumption starting from Q3 2020 could be explained by the fiscal stimulus measures mitigating the effects of the pandemic, as well as favorable growth of credit and lending in the economy. Investment had a small positive contribution to growth in the first quarter of 2020, and a small negative contribution of 3.3% and 2.1% in the second and third quarters of 2020 respectively. Net export was the main contributor of the economic slowdown in all three quarters of 2020, and the drop was mainly driven by the disruption in tourism revenues. The second quarter of 2020 saw a decline in all three categories of expenditure, negatively contributing to GDP growth. (see figure above).
National and Foreign Currency Deposits.
The first set of variables with a moderate effect on our forecast relates to national and foreign currency deposits in commercial banks. All categories of national currency deposits experienced growth in annual terms, while some of them decline on a month-to-month basis in January. In particular, national currency demand deposits saw an annual increase of 9.9%, while time deposits increased by 86.8% annually.
Consequently, national currency total deposits increased by 37.3% yearly. In the same period, time deposits increased by 7.1% in monthly terms, while demand deposits and currency in circulation decreased by 7.3% and 5.2% respectively, compared to the previous month.
In contrast to domestic currency deposits, foreign currency total deposits increased relatively moderately, by 27%, compared to the same month of the previous year. In the same period, nearly all categories of foreign currency deposits increased by more than 10% annually. The annual growth of foreign currency deposits is partially driven by the depreciation of the national currency. Nevertheless, growth rates are still pronounced even after excluding the exchange rate effect. As a result, deposit dollarization increased by 1 percentage points monthly and decreased by 2.1 percentage points yearly. Despite the positive annual trends, deposit-related variables still had a slight negative contribution to real GDP growth based on our model.
VAT Turnover.
As far as other variables of interest go, VAT turnover in January decreased by 13.7% yearly and 17.6% monthly. Consequently, this variable had a negative contribution to real GDP growth.
External Merchandise Trade.
In January, Georgia’s exports saw a 16.2% annual decline. This drop was driven by a reduction in the re-export of motor cars from Azerbaijan; alongside the export of ferroalloys and natural grape wines to Russia; re-export of motor cars to Armenia; re-export/export of motor cars, chemical and natural fertilizers to Ukraine; and export of raw gold to Switzerland. In contrast, Georgian export of ferroalloys to the USA; copper ores and concentrates to Bulgaria; and hazelnuts and walnuts to Germany registered an annual increase.
During this period, the import of goods decreased by 16.6%, driven by a reduction in petroleum and fuel product imports from Russia and Azerbaijan (mostly due to a significant annual reduction of crude oil prices on the international market in annual terms). Among other negatively affected imports were: precious metals, copper ores and concentrates from Armenia; carbon steel rods from Ukraine; motor cars and Portland cement from Turkey; motor cars from USA, Germany and Japan; and paving tiles from Iran.
In contrast, Georgian imports of drilling machines and ready-made garments from China; and trucks and metalworking machines from Italy experienced yearly growth. Consequently, the trade deficit shrank dramatically by 16.8% yearly, and amounted to 313.6 million USD. Overall, trade related variables had a positive contribution to the GDP growth forecast.
Money Inflow.
After a significant slowdown in money inflows at the beginning of the previous year, remittances were on the path of recovery. In January, remittances increased by 19.2% yearly. The main contributors to this increase were Italy (by 29.7% YoY, contribution 5 ppts), USA (by 33.2% YoY, 3.6 ppts), Greece (by 25.2% YoY, 3 ppts), Azerbaijan (by 213.1% YoY, 2.9 ppts), Ukraine (by 80.6% YoY, 2.3 ppts), and Germany (by 57.2% YoY, 1.8 ppts). Whereas money inflows from Russia declined (by 11.4% YoY, -2.4 ppts). The recovery of remittances flows made a positive contribution to the growth forecast.
International Visits and Tourism.
Tourism arrivals and receipts declined sharply as a result of numerous travel bans and precautionary behavior on the part of potential tourists. In January, the number of international visitors decreased by 93.6% yearly (driven by Azerbaijan [-23.2 ppts], Armenia [-16.7 ppts], Russia [-16.2 ppts], Turkey [-11.6 ppts] and EU [-4.1 ppts]), while the decline in tourist numbers (visitors who spent 24 hours or more in Georgia) amounted to 91.9%. Overall, dramatically declining numbers of visitors and tourists, along with a sharp decrease in touristic spending, has made a significant negative contribution to the growth forecast.
Foreign Direct Investment.
Foreign direct investment (FDI) in Georgia amounted to only $616.9 million in 2020, which is 52.9% lower than in 2019. According to Geostat, the main reasons for decreasing FDI included transfer of ownership from non-resident to the resident units in several companies, which reduced the value of FDI by $340.5 million. In addition, FDI experienced notable reductions in hotels and restaurants (284.3% yearly, contributing 26.1 ppts, mostly due to change of ownership), energy (97.8% yearly, -19.5 ppts contribution), transport (77.1% yearly, -3.2 ppts), manufacturing (41% yearly, -3.6 ppts), communication (33.4% yearly, -1.8 ppts) and health and social work (24.6% yearly, -0.3 ppts) sectors, while FDI increased in real estate, renting and business activities (729% yearly, 4.8 ppts), mining (93.8% yearly, 3.7 ppts), construction (76.3% yearly, 2.1 ppts), agriculture (56.2% yearly, contributing only 0.2 ppts to FDI growth, as agriculture still remains a very small part of the overall foreign investment) and financial (47.1% yearly, 9.8 ppts) sectors. The recent trends in FDI are not taken into consideration in our model yet.

Real Effective Exchange Rate.
In January, the Georgian lari real exchange rate depreciated sharply both in monthly and yearly terms against all main trading currencies. The Real Effective Exchange Rate (REER) depreciated by 0.9% relative to the previous months, and by 9.1%, relative to the same month of the previous year. Notably, the lari real exchange rate depreciated with respect to the euro, the US dollar and Turkish lira by 18.8%, 11.3% and 2.3% respectively in yearly terms, but appreciated with respect to the euro and dollar both by 0.4%. REER appreciated with respect to the Russian ruble by 0.6% and 2.9% respectively in monthly and annual terms. Depreciation of the REER is typically associated with domestic export goods gaining competitiveness on the foreign markets, but it also translates into increased prices on imported goods. Overall, REER-related variables had a small negative contribution to the real GDP growth projections.
Inflation.
In January, the annual inflation of consumer prices amounted to 2.8%, which is only slightly lower than the targeted 3%. However, the relatively low level of inflation over the last two months is related to the government subsidy of utility fees (which reduced annual inflation rate by 1.6 ppts). Approximately 1.8 percentage points of CPI inflation was due to higher food prices (increased 6.3% annually), while tobacco prices contributed 0.3 percentage points to CPI. However, decreased oil prices made a notable negative contribution (0.7 ppts) to the annual inflation measure. The latter trend is mostly a reflection of significantly weakened oil prices on the global market (Euro Brent Spot Price (COP) decreased by 14.2% yearly). Meanwhile, the measure of core inflation amounted to 5.7%. Overall, CPI related variables had a slight negative contribution to the GDP forecast.
World prices.
The other variables to have a negative contribution to growth forecast are the Metals Price Index (PMETA), and the Agricultural Raw Materials Index (PRAWM). In January, metal prices, in annual terms, increased by 32.4%, while the price of agricultural raw material prices increased by 8.6% in annual terms. Adding the PMETA and PRAWM indicators to the model decreases the growth forecast for the first and second quarters of 2021.
Consumer Credit.
In January 2021, the total volume of commercial banks’ consumer credit increased by a mere 0.1% monthly and by 14.7% yearly. However, the credit volume of commercial banks’ short-term consumer credits declined by 2.7% and 7.5% in monthly and yearly terms, respectively (the main driver behind this negative trend being short-term consumer loans in foreign currency, which increased by 4.1% monthly, but went down by 43.4% annually), whereas the credit volume of commercial banks’ long-term consumer credits increased by 0.2% monthly and 15.8% yearly. Overall, the variables related to consumer credit have had a negative impact on the growth forecast.
By Davit Keshelava & Yasya Babych


