In June 2022, the National Statistics Office of Georgia issued its annual publication on the agricultural sector – Agriculture of Georgia 2021. The publication estimates that agriculture, forestry, and fishing comprised 7% of the GDP in 2021, which was lower than the 8.3% share in 2020, but in line with the general trend over the last few years (agricultural GDP being 7-8% of GDP on average). Furthermore, compared to 2020, agricultural GDP decreased by 1.4% in real terms in 2021. One explanation might be the so-called “base-year effect”, as 2020 was a good year in terms of harvest that led to increased agricultural production for the year. In 2021, the production from the hay of annual grasses increased by 58%, potatoes by 12%, sunflowers by 11%, and cereals by 6%. Meanwhile, the production of haricot beans, hay of perennial grasses, vegetables, and melons decreased by 19%, 18%, 15%, and 7%, respectively.
The production of all permanent crops, excluding pome fruits and grapes, increased in 2021 compared to the previous year. The greatest increase of 48% was observed in berries, while the production of said pome fruits (apples, pears, quinces) declined by 15%. As for livestock production, both meat and wool rose by 5%, milk increased by 3%, while egg and honey production decreased by 3% and 17%, respectively.
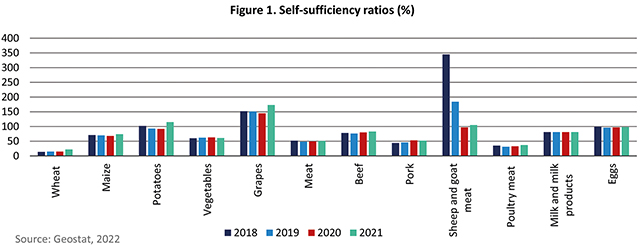
In terms of self-sufficiency ratios, over the last five years there has been a rise observed for wheat, from 15% reaching 22% in 2021. After a declining trend for maize seen during the last year, the crop came back strong at 74%. Moderately high growth can also be seen with grapes and potatoes, by 28 and 23 percentage points, respectively. A slight increase of 8% was found with sheep and goat meat. The self-sufficiency rate for vegetables and pork fell marginally, although the same indicator for meat overall rose slightly. The remaining ratios were almost unchanged (Figure 1).

PRICE HIGHLIGHTS
DOMESTIC PRICES
On a monthly basis, the country’s price levels rose between March and May 2022. The Consumer Price Index (CPI) increased by 2.5% in March 2022 compared to February. The corresponding month-over-month price increase was 1.8% in April 2022. While in May 2022, consumer prices increased marginally (by 1.1%) over the previous month.
Between March and May 2022, the price of food and non-alcoholic beverages, measured by the Food Price Index (FPI), also exhibited an upward trend. In March 2022, food prices rose by 2.0% from the previous month. Whereas in January and February, the corresponding month-over-month price changes were 3.3% and 0.8%, respectively.
From an annual perspective, the CPI continued to increase between March and May 2022. This March, the CPI grew by 11.8% compared to March 2021; the corresponding YoY changes were 12.8% and 13.3%, respectively, for April and May of 2022.
In May 2022, the year-over-year prices for food and non-alcoholic beverages also rose significantly, by 22%, contributing 6.88 percentage points to the change in total CPI. The main drivers were the price increases in the following sub-groups: vegetables (+51.1%), mineral waters, soft drinks, fruit and vegetable juices (+34.5%), and bread and cereals (+23.5%).

SPOTLIGHT
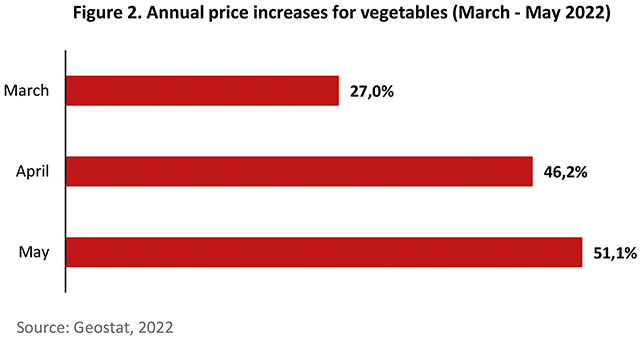
Between March-May 2022, food prices in the vegetable sub-category exhibited an upward trend. In March, prices for vegetables jumped by 27% over March 2021, while the corresponding price increase was 46.2% in April 2022. The annual increase in vegetable prices during the indicated period marked its highest level of 51.1% in May 2022. According to Geostat, prices rose for all products in the vegetable sub-category within May 2022. The largest upsurges in price were observed for cabbages (297%) and cucumbers (110%). Such sharp increases in vegetable prices might be the result of decreased production, or international market trends that reflect concerns over diminished production, enhanced agricultural input prices, rising crude oil prices, and the escalating tensions in the Black Sea region due to the Russian invasion of Ukraine.
Trade statistics reveal that from March-May 2022 the export value of vegetables amounted to 6.8 mln. USD, which was 23% lower than the same indicator in March-May 2020 (8.8 mln. USD). Meanwhile, the value of imported vegetables increased sharply (by 39%) from 12.1 mln. to 16.9 mln. USD in comparison to the same period last year. An increase in import and a decrease in export might prove a sign of the falling domestic production of vegetables.
Although the statistics for domestic production in the spring season of 2022 are not yet available, it is interesting to review Geostat’s recent Agriculture of Georgia 2021 publication. In 2021, vegetable production dropped by 15% – from 176.1 ths. tons to 149 ths. tons. The average yield of vegetables in 2021 also decreased by 7%, from 11.1 tons per ha. to 10.3 tons per ha. Such a decline in domestic production and productivity levels pushed vegetable prices up in 2021. Therefore, it might have initiated rising imports across the first half of 2022 and influenced the swelling price of vegetables (Figure 2).

INTERNATIONAL PRICES
Between March and May 2022, international prices exhibited an upward trend on an annual basis. In March 2022, the Food Price Index, measured by the Food and Agriculture Organization (FAO), rose sharply (by 34%) compared to March 2021, and marked its all-time high. In April and May 2022, the corresponding food price increases were 29.7% and 22.8%. While in May, the largest price increase was observed within the vegetable oil (31%) and cereal (30%) sub-indices. Such a sharp leap in the cost of vegetable oil was driven by rising concerns over disruptions in the Black Sea region and logistical bottlenecks. The steep rise in cereal prices was driven by increases in the price of wheat, reflecting export restrictions amidst concerns over crop conditions in numerous leading exporting countries, as well as reduced Ukrainian production because of the war.
TRADE HIGHLIGHTS
Total Georgian export continued to maintain significant growth, and in January-May of 2020 it rose by 38% compared to the same period in 2021 (from 1,536 mln. to 2,112 mln. USD). However, the growth in agricultural export remained moderate, therefore it did not play an important role in overall growth. Agricultural exports themselves grew slightly from 396 mln. USD in 2021 to 400 mln. in 2022 (1%).
Meanwhile, the share of agricultural exports in total export decreased from 26% to 19% in 2022. One explanation might be that other sectors of the economy recovered after the pandemic, as reflected in increased total exports, while the corresponding share of agricultural exports fell.
Total Georgian import increased by 37% – growing from 3,512 mln. USD in Jan-May 2021 to 4,822 mln. USD in the same period of 2022. Agricultural imports amounted to 631 mln. USD in 2022, which is significantly higher (27%) than the 498 mln. USD in the respective period of 2021. The share of agricultural imports in total import remains at a similar level, with only a small decrease (from 14% in 2021 to 13% in 2022).
Overall, the positive trend from the start of the year continues and hopefully will be maintained throughout the year.
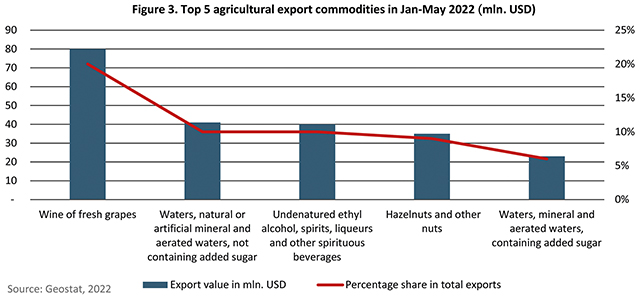
The top agricultural export commodity, as usual, was wine from fresh grapes. Its export value amounted to 80 mln. USD in Jan-May 2022, and held a share of 20% of total agricultural export. The export of mineral waters amounted to 41 mln. USD and spirit-based beverages to 40 mln. USD – both holding a share of 10%. While hazelnut and other nut exports equaled 35 mln. USD (a share of 9%), and waters containing added sugar reached 23 mln. USD (6%).
The highest growth is seen for milling industry products, which increased almost seven times – from 1,892 ths. to 14,780 ths. USD (681%). This can be explained by rising international wheat prices and the ongoing war in Ukraine, both hindering import from Georgia’s main trade partners. A significant jump was also seen in vegetable plaiting materials, from 6 ths. to 30 ths. USD (369%), and followed by an increase in the import of live animals, by 85% from 2,018 ths. to 3,743 ths. USD. For vegetable saps and extracts, it stands at 82% growth, from 162 ths. to 295 ths. USD. Lastly, the respective changes in import values for edible products of animal origin showed an 80% rise, from 8,212 ths. to 14,753 ths. USD (Figure 3).
POLICY WATCH
The Government of Georgia subsidizes agricultural landowners
According to the State Program for Supporting Agricultural Landowners, the government is subsidizing farmers by giving out points on agro-cards. The subsidy for agricultural land was set at 300 GEL per hectare (300 points accrued on an agro-card). Under the program, landowners or co-owners receive subsidies for owning 0.25 ha. up to 1.25 ha. of agricultural land. These points can be used for purchasing agricultural goods, herbicides, pesticides, seed materials, agricultural implements, etc. within specialized agricultural goods shops.
For more information follow this link: http://mepa.gov.ge/Ge/News/Details/20836
The Government of Georgia approves a regulation on criteria and indicators for sustainable forest management
On the initiative of the Ministry of Environmental Protection and Agriculture of Georgia, in cooperation with international experts, the Criteria and Indicators for Sustainable Forest Management in Georgia (C&I) document has been developed, which aims to create legal instruments for reporting on the state of, the management quality, and on the sustainability of forests in Georgia. The development of these national criteria and indicators for sustainable forest management has been implemented under the support of the German Society for International Cooperation (GIZ), as part of their Integrated Biodiversity Management in the South Caucasus (IBiS) project.
For more information follow this link: http://mepa.gov.ge/Ge/News/Details/20822


