The National Statistics Office of Georgia (GeoStat) recently published its economic review for the second Quarter of 2022. Their publication highlights that agricultural production increased by 10.9% in Q2 compared to the same period of 2021. Furthermore, agriculture contributed to 8.3% of the country’s total GDP during this period.
There were also positive trends in Foreign Direct Investments (FDI) within the sector. In the second quarter of 2022, FDI in agriculture accounted for 3.2 mln USD compared to -1.7 mln USD in 2021.
Nevertheless, FDI in agriculture was relatively low in comparison to other sectors of the Georgian economy and accounted for just 0.9% of total FDI.
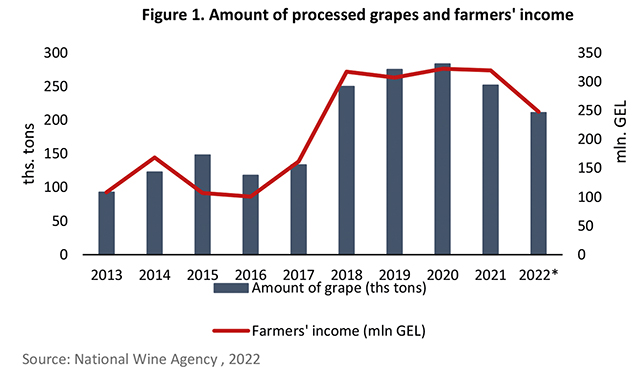
On 24 August, the “Rtveli 2022” harvest started. As with previous years, the Government of Georgia (GoG) is again subsidizing the 2022 grape harvest to help farmers and wine producers sell their products. During Rtveli 2022, wine companies will receive a subsidy if they purchase and process at least 100 tons of green Rkatsiteli or Kakhuri grapes grown in the Kakheti region, and if the company pays at least 0.90 GEL per kg for the fruit; 0.35 GEL will be subsidized from a total of 0.9 GEL per kg of grapes purchased. Under this support program, up to 25 ths farmers will be able to sell their produce and about 300 wineries will be involved in grape harvesting, storing, and handling activities. GoG has allocated a total of 150 mln. GEL to subsidize the 2022 grape harvest. By 30 September, around 211.1 ths tons of grapes were sold, with a corresponding sales revenue of 247.9 mln. GEL for farmers (Figure 1). However, since Rtveli is not yet over, the final statistics on grape sales and their respective total revenue is not yet available.
PRICE HIGHLIGHTS
DOMESTIC PRICES
On a monthly basis, the country’s price levels were steady between June-August 2022. The Consumer Price Index (CPI) remained almost unchanged in August 2022 (with a slight increase of 0.14%) compared to July 2022. While in June and July 2022, consumer prices increased marginally (by 0.2%) over the previous month, showing signs of stabilization after a volatile spring.
Between June-August 2022, monthly prices of food and non-alcoholic beverages, measured by the Food Price Index (FPI), also held steady. In August 2022, food prices rose marginally, by 0.9%, compared to July 2022; while the corresponding month-over-month price changes in June and July were 0.1% and -1.4%, respectively.
From an annual perspective, the CPI continued to grow between June and August 2022. In June 2022, the CPI rose by 12.8% compared to June 2021, while the corresponding year-over-year changes were 11.9% and 10.9% for July and August 2022, respectively.
In August 2022, the year-over-year prices for food and non-alcoholic beverages also increased significantly (by 15.8%), thus contributing 5.14 percentage points to the change in total CPI. The main drivers were price increases in the following sub-groups: bread and cereals (+32.4%), milk, cheese, and eggs (+20.8%), mineral waters, soft drinks, fruit and vegetable juices (+20.3%).

SPOTLIGHT
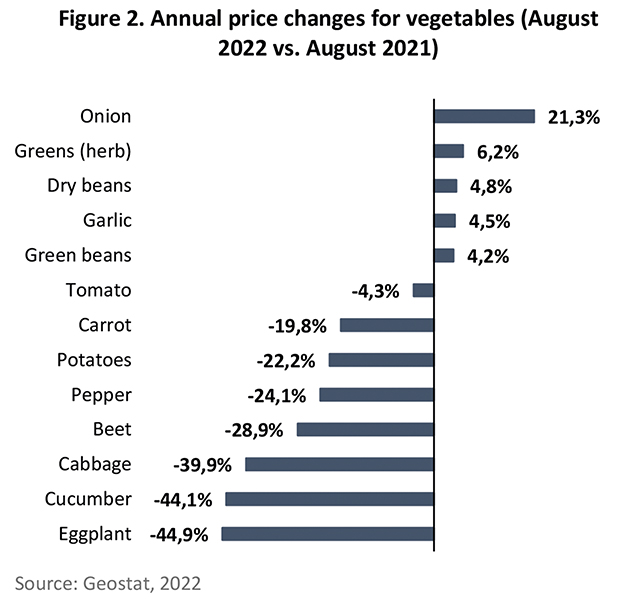
Over the last year, food prices in the vegetable sub-category exhibited an upward trend. In August 2022, prices in the vegetables sub-category started to fall: the year-over-year prices of vegetables decreased by 9.6%, while the month-over-month prices dropped by 6.6%. According to GeoStat data, in August 2022, annual price decreases were observed for eggplants (-44.9%), cucumbers (-44.1%), cabbages (-39.9%), beets (-28.9%), peppers (-24.1%), potatoes (-22.2%), carrots (-19.8%), and tomatoes (-4.3%). Meanwhile, upsurges in price were seen with onions (21.3%), greens (6.2%), dry beans (4.8%), garlic (4.5%), and green beans (4.2%) (Figure 2).
Declining vegetable prices might be the result of increased production, or the so-called base-year effect. In 2021, vegetable production dropped by 15% – from 176.1 to 149 ths. tons. The average yield of vegetables in 2021 also decreased by 7% – from 11.1 to 10.3 tons per ha. Such a decline in domestic production and productivity level pushed vegetable prices up in 2021, and therefore might have influenced swelling prices and increased imports across the first half of 2022. Between January-July 2022, the import value of vegetables was higher each month compared to the same months in 2021. Whereas, the import of vegetables decreased by 28% in August 2022 compared to the previous August.
Meanwhile, the export value of vegetables rose more than three times during the same period. Although the statistics for domestic production are not yet available for 2022, a decline in imports and growth in exports might indicate an increase in the domestic production of vegetables.

INTERNATIONAL PRICES
Between June and August 2022, international prices registered their fifth consecutive monthly decline, however they remained well above the levels of the previous year. In August 2022, the Food Price Index, measured by the Food and Agriculture Organization (FAO), increased drastically – by 7.9% over August 2021. Notably, prices increased within the dairy (23.5%), cereal (11.5%), and meat (8.2%) sub-indices.
Meanwhile, prices decreased in the categories of sugar (-8.4%) and vegetable oils (-1.5%). In August 2022, the UN-brokered Black Sea Grain Initiative helped restart the export of wheat from Black Sea ports in Ukraine for the first time after five months of interruption, thereby bringing downward pressure on the monthly prices of grains, cereals, and oils.

TRADE HIGHLIGHTS
In 2022, total exports between January-August reached 3,571 mln. USD compared to the 2,608 mln. USD from January-August of 2021 – corresponding to a strong 37% annual increase. Equally, agricultural exports showed a relatively moderate, however, still notable 10% increase (from 683 mln. USD in Jan-Aug 2021 to 750 mln. USD in 2022). Overall, the share of agricultural exports in total exports decreased from 26% in 2021 to 21% in 2022.
Total imports also demonstrated significant intensification, from 6,126 mln. USD in 2021 to 8,365 mln. USD in 2022 (37%). Agricultural imports closely followed this trend and also increased by exactly 37% – from 812 mln. USD in 2021 to 1,111 mln. USD in 2022. Correspondingly, the share of agricultural imports in total imports has remained unchanged and remained at 13% for both years.
Based on these abovementioned trends, trade continues to play an important role in economic recovery. Although the national currency appreciated during the summer, exports still managed to maintain a significant positive trend. At the same time, currency appreciation might have played a role in boosting imports.
In July of 2022, total monthly exports reached a record high value of 542 mln. USD, amounting to a notable 40% increase compared to July 2021 (386 mln. USD). Similarly, agricultural exports rose from 104 mln. USD in July 2021 to 125 mln. USD by this July (a 20% increase). Aside from the well-known top five export commodities, we can also observe a significant increase in the export of fresh fruit in July, specifically apricots, cherries, peaches, plums, and sloes.
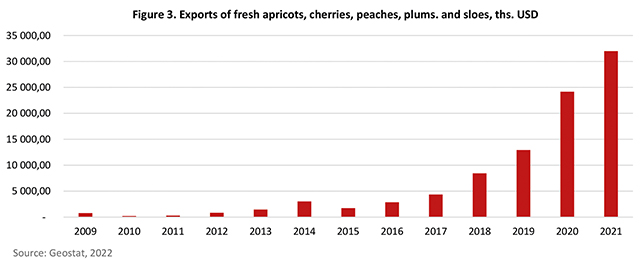
The export dynamics of these particular fresh fruits over the years has been depicted on the Figure 3.
During the last few years, this food category saw a notable increase (64% on average from 2016), which was also present in 2022 (30 mln. USD in the January-August period). The trend is most likely related to increased domestic production paired with increased exports to Russia, which acts as the main destination market for Georgian fruit export. Exports to Russia have showed an upward trend since the ban on the import of agricultural products from Georgia was lifted in 2014. Since that stage, the dependence of fruit exports on the Russian market has significantly increased, resulting in higher production but lower market diversification.
The highest growth is seen for milling industry products, which increased almost seven times – from 1,892 ths. to 14,780 ths. USD (681%). This can be explained by rising international wheat prices and the ongoing war in Ukraine, both hindering import from Georgia’s main trade partners. A significant jump was also seen in vegetable plaiting materials, from 6 ths. to 30 ths. USD (369%), and followed by an increase in the import of live animals, by 85% from 2,018 ths. to 3,743 ths. USD. For vegetable saps and extracts, it stands at 82% growth, from 162 ths. to 295 ths. USD. Lastly, the respective changes in import values for edible products of animal origin showed an 80% rise, from 8,212 ths. to 14,753 ths. USD (Figure 3).
POLICY WATCH
Technical Regulation on Food (Feed) Additives will come into effect on 1 June 2023
Within the framework of legislative approximation with the European Union, the Government of Georgia developed and approved a draft resolution – the Technical Regulation on Food (Feed) Additives – which will come into force on 1 June 2023. The technical regulation determines an approved list of vitamins and minerals, as well as their chemical forms, permitted to be used in the production of food and feed supplements. Any business operator who places a food (feed) additive on the market will be obliged to notify the National Food Agency in advance and submit corresponding food samples. These supplements must meet the requirements determined by the technical regulation, otherwise a business operator will not be permitted to sell on the market.
For more information follow this link: https://mepa.gov.ge/En/News/Details/20929/
There will be an amendment to the National Waste Management Strategy of Georgia 2016-2030
On 8 August 2022, the Government of Georgia made the decision to amend the National Waste Management Strategy of Georgia 2016-2030, and to develop the New National Action Plan 2022-2026. Under the amendment, four new strategic objectives – improvement in hazardous waste management and plastic waste management, the creation and implementation of biodegradable waste collection and treatment systems, and improved management for inert, construction, and demolition waste – will be added to the nine existing goals within the strategy. The Ministry of Environmental Protection and Agriculture will coordinate implementation of the strategy, as well as the National Action Plan for Waste Management.
For more information follow this link: https://mepa.gov.ge/En/News/Details/20960/


