The global economic recovery is ongoing; however, the Covid-19 pandemic is still causing considerable volatility. Since the beginning of 2021, inflation rates have increased in both advanced and emerging economies, generally driven by pandemic-related supply-demand mismatches and rapidly rising commodity prices, following a global decline in inflation over the course of 2020. According to the latest forecasts, for most countries, upward price pressures are expected to subside with a return to pre-pandemic levels by mid-20221. With this in mind, it is pertinent to compare the inflationary trends of Georgia with global patterns.

In Georgia, the year-on-year (YoY) Consumer Price Index (CPI), which measures the average price of goods and services acquired by consumers compared to the reference period, has proved relatively similar to global trends, as in December 2020 the inflation rate2 showed a significant decline of 4.6 percentage points compared to December 2019, reaching 2.4%, a major decrease (25.4 pp) in prices coming from the “housing, water, electricity, gas and other fuels” category, which can be explained by the introduction of utility subsidies for households from November 20203 and plummeting global oil prices in the middle of 20204. This figure was still higher than the lowest figure of the reporting period, which was recorded in December 2018 (1.5%). Since the beginning of 2021, monthly YoY CPI inflation has been increasing sharply, surpassing pre-pandemic levels, and reaching its peak to date of 12.8% in October 2021, with a 10 pp increase from the beginning of the year.
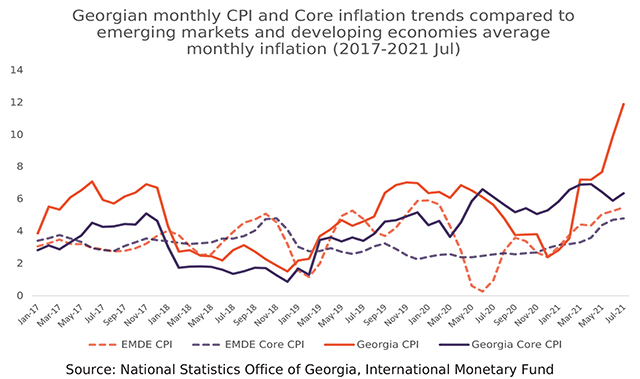
On the contrary, YoY monthly core inflation increased in the middle of 2020, reaching 6.6% in June 2020 (with significant increases in prices of routine household maintenance, healthcare, and restaurants and hotels) and this has continued to be relatively stable, with a monthly average value of 5.8% over the 2020-2021 period, while the pre-pandemic (2017-2019) monthly average was equal to 3.1%. The magnitude of the fluctuations was significantly lower in the case of core inflation compared to CPI inflation, which could be explained by the fact that the most significant price variations have tended to come under the food and energy categories.

The Producer Price Index (PPI) measures price changes from the perspective of costs to industry and producers, and can sometimes act as a leading indicator of inflationary developments. From May 2021 to September 2021, the YoY monthly PPI inflation became relatively stable, with a monthly average value of 15.9% after a sharp 5.7 pp increase from the end of 2020 until April 2021. Meanwhile, according to the BAG index5, the majority of the surveyed businesses do not expect the prices of their products to rise in the fourth quarter of 20216, which could be a signal of what to expect with respect to price change dynamics in the near future.
Furthermore, it is important to analyze the contributions of different spending categories to the average YoY monthly inflation in the first 10 months of the given year. It must be noted that in 2021 the average CPI inflation rate of 10 months reached the maximum (8.8%) of the reporting period.
Considering that in emerging and developing markets, food and beverage accounts for a larger proportion of the consumer basket, this product group has been the main driver of the rise in inflation throughout the reporting period. In particular, the price increase for food and non-alcoholic beverages accounted for 3.3 pp of the average YoY monthly inflation. In the first 10 months of 2021, the price increase in transport and communication accounted for 1.9 pp of total inflation, making this group the second-highest contributor to inflation.

Elsewhere, the average prices of health-related products also recorded significant increased compared to previous years. The price increase of housing, water, electricity, gas, and other fuels amounted to only 0.4 pp of total inflation, which does not fully depict the real price increase of the products, due to continuation of partial utility subsidies from March of 20217.
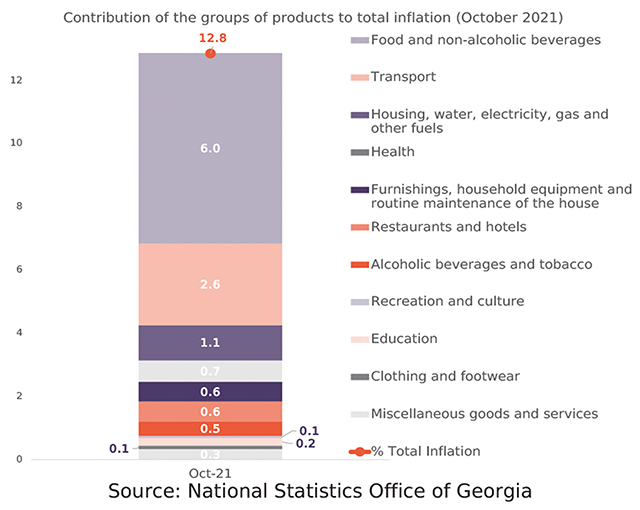
A closer look at the contributions of the record-high YoY monthly inflation rate in October 2021 reveals certain trends. In October 2021, the YoY increases in prices of food and non-alcoholic beverages accounted for 6.0 pp of total 12.8% inflation (with the highest price increases in vegetables, sunflower oil, sugar, and eggs). The contribution of transportation prices to total YoY monthly inflation was equal to 2.6 pp, followed by housing, water, electricity, and gas products (explained by a combination of rising prices of Georgian utilities since January 2021, and the general increase in global gasoline prices). Meanwhile, price increases in restaurant and hotel services also accounted for a significant proportion of YoY monthly inflation in October 2021.
Notably, the monthly YoY inflation rate in Georgia has been relatively high compared to the average across emerging markets and developing economies throughout the reporting period8. The figure for EMDE reached a low of 0.3% in June 2020, while in Georgia, inflation at that time was equal to 6.5% and showing only slight decreasing trends. During the first two months of 2021, CPI inflation in Georgia was similar to the average figure, but since March 2021, the monthly inflation of Georgia has been significantly higher than the average, reaching 11.9% in July 2021, while in the same period the average monthly inflation of emerging markets and developing countries was 5.5%. Similarly, the monthly YoY core inflation of Georgia was higher than the average from 2019 until the end of the reporting period, albeit nearing the group average (4.7%) in June 2021

In terms of average annual inflation, the comparison between Georgia and Eastern Partnership (EaP) countries and those of the Balkan region illustrates some slight differences. In 2020, the average annual inflation in Georgia was equal to 5.2%, which is 1.6 pp higher than the average for EaP countries and 3.7 pp higher than the average annual inflation for Balkan countries. However, according to IMF forecasts, inflation in Georgia will plummet, reaching 3% in 2023 and following a similar trend to the Balkan region, while on average being 1.1 pp lower than the forecasted inflation of the EaP region throughout 2022-2026.
Inflation Targeting Regime in Georgia
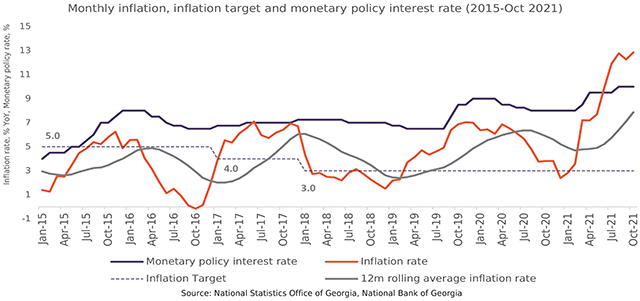
To address high and volatile inflation and its adverse effects on the economy, the National Bank of Georgia has been conducting monetary policy with the aim of keeping the inflation rate at an optimal level. In the initial phase (2009-2014) of the inflation targeting, the optimal level of inflation equalled 6%, which eventually dropped to 5% in 2015, then 4% in 2017 and since 2018, the inflation target of Georgia has been equal to 3%. The main tool used by the NBG for targeting inflation is a monetary policy interest rate.

Throughout 2015-2016, the monetary policy rate reached a maximum of 8% in December 2015, which was later eased out. This could be explained by the rolling average inflation of 12 months reaching its targeted inflation rate in April 2016. The monetary policy rate was relatively stable throughout 2017-2018, with an average value of 7%. However, in response to increasing inflation at the beginning of 2019, the monetary policy rate increased to 9% by December 2019. Consequently, the monetary rate was reduced to 8% from August 2020 to February 2021. It must be noted that after tightening the monetary policy, both the YoY monthly inflation rate and the 12-month rolling average inflation rates showed significant downward trends. In September 2021, to combat rapidly increasing inflationary trends, the monetary policy rate was increased to 10%. According to NBG forecasts9, the monetary policy rate will be kept high and only in the medium term will it decrease to the optimal 6.5% rate. However, in the alternative scenario which considers a higher domestic demand, the monetary policy rate is expected to increase by 3.1 pp in 2022, thus allowing actual inflation to meet the 3% inflation target for the second quarter of 2022.

References:
1 Source: International Monetary Fund: World Economic Outlook – Recovery During a Pandemic, October 2021
2 Note that throughout the text inflation is referred to price changes compared to corresponding period of the previous year.
3 https://matsne.gov.ge/ka/document/view/5026401?publication=0
4 https://blogs.worldbank.org/opendata/oil-market-outlook-lasting-scars-pandemic
5 BAG Index is a quarterly report made by Business Association Georgia (BAG) and PMC Research Center. It measures the latest perceptions and short-term expectations of Georgian businesses.
6 Source: BAG Index – Business Climate, Quarter III
7 https://matsne.gov.ge/ka/document/view/5080717?publication=0
8 The average values of the emerging markets and developing economies are calculated throughout 2017-July 2021 within the IMF: World Economic Outlook October report.
9 National Bank of Georgia: Monetary Policy Report, Q4
![]()


