Poverty alleviation remains one of the biggest challenges for the world, including Georgia. The COVID-19 crisis has worsened the problem, seeing many household incomes shrinking even further. According to a public opinion poll conducted by NDI in 20201, 39% of respondents indicated that poverty was the main issue they were facing. Against this background, we will take a closer look at poverty in Georgia and discuss the trends, and changes seen over the last decade.
Methods applied to determine the poverty rate vary from country to country, so in order to gain a broad understanding of the current situation regarding poverty in Georgia at the international level, it is important to take into account a variety of indicators.
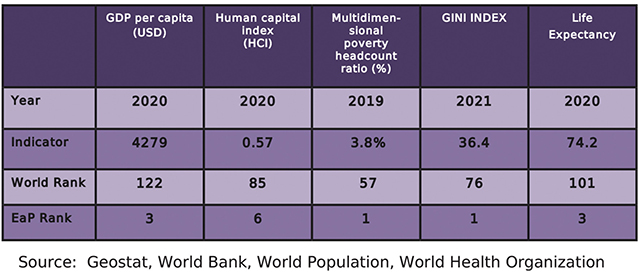
In 2020, GDP per capita in Georgia amounted to 4279 USD, ranking it 122nd in the world and 3rd among Eastern Partnership (EaP) countries. Meanwhile, the Human Capital Index (HCI)2 calculates the contributions of health and education to worker productivity, with Georgia scoring 0.57 in 2020, ranking 85th out of 174 countries in the world and having the lowest score among EaP countries.
Multidimensional poverty encompasses various forms of deprivation experienced by poor people, such as poor health, lack of education, inadequate living standards, poor quality of work and the threat of violence. In 2019, 3.8% of the population in Georgia was multidimensionally poor, ranking 57th out of 120 countries in the world and first among EaP countries.
The Gini Index measures income distribution within a society. In 2021, Georgia scored 36.4 on the Gini Index, ranking 76th out of 165 countries and having the highest inequality rate among EaP countries. In terms of life expectancy, in 2020, average life expectancy in Georgia was 74.2 years, ranking it 101st in the world and 3rd among EaP countries. Taking into account these indicators, Georgia, on an international level, is an upper-middle-income3 country with moderate rates of inequality and life expectancy. Due to its poor educational and healthcare systems, Georgia has been unable to mobilize its human capital to achieve a higher level of economic development4.
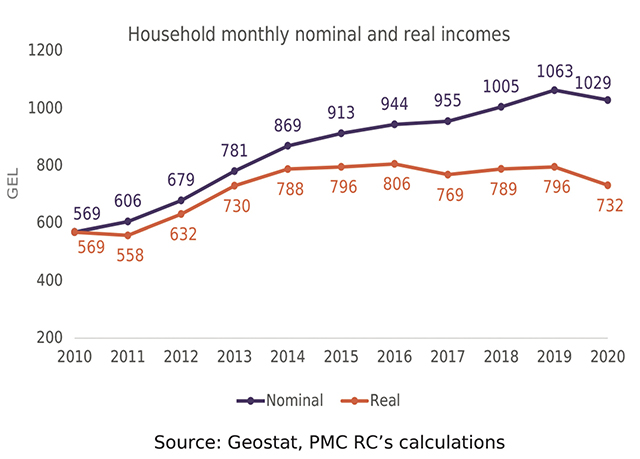
Household monthly nominal and real incomes
As poverty is strongly determined by income, we start the analysis of the poverty trends in Georgia over the last decade with a look at household income through this period of time. From 2010 to 2020, household nominal income rose noticeably. For instance, the average monthly income in 2010 in Georgia was 569 GEL, whereas by 2020 it had risen to 1029 GEL. The average growth rate over this period amounted to 6%. From 2010 to 2015, household income increased more significantly (by 10%), whereas from 2016 to 2020, the growth rate was 2%. In 2020, due to the COVID-19 crisis, the average household income dropped by 3% compared to 2019.
As Georgia recorded a high inflation rate over the last decade, we now take a look at average household income (adjusted for inflation). Average real income, unlike nominal income, increased more modestly and experienced fluctuations over the last decade. From 2010 to 2020, this increased by 163 GEL and reached 732 GEL. Real income in this period peaked in 2016 at 806 GEL. Thereafter, it started to stagnate and in 2020, partly due to COVID-19 pandemic, plummeted to 2013 levels.
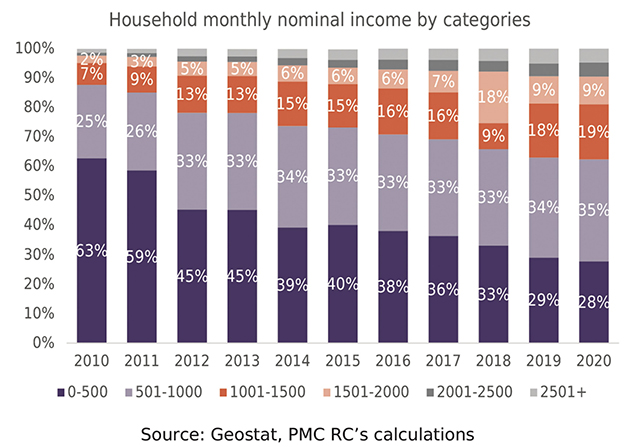
Monthly nominal income by category
If we sort households into different income groups, it can be seen that the lowest income group (those receiving 0 to 500 GEL per month) has decreased significantly through the last decade by 35 pp, going from 63% in 2010 to 28% in 2020. Meanwhile, the size of all other income groups increased overall. For instance, comparing the figures of 2020 with 2010, the percentage of households receiving between 501 and 1000 GEL per month increased by 10 pp, while households receiving 1001-1500 GEL rose by 12 pp.
In 2010, 95% of households fell into the three lowest income groups and 88% fell into the two lowest categories. By 2020, these figures dropped to 81% and 63% respectively. Even though household nominal income has increased over the last decade, in 2020 a total of 63% of households in Georgia still had nominal below 1000 GEL. Moreover, the real income statistics adjusted to 2010 prices revealed that 63% of households had an income of 711 GEL or less.
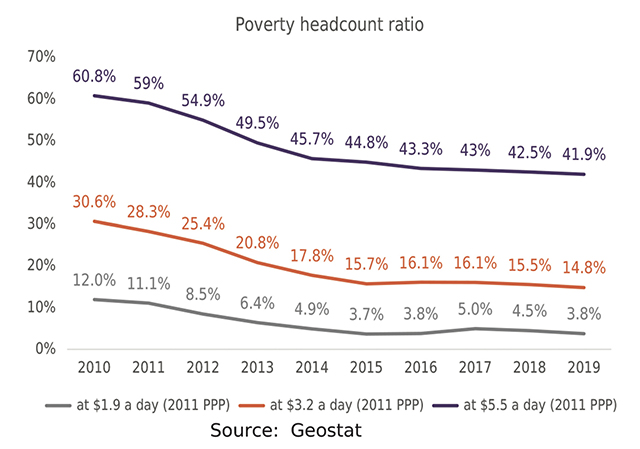
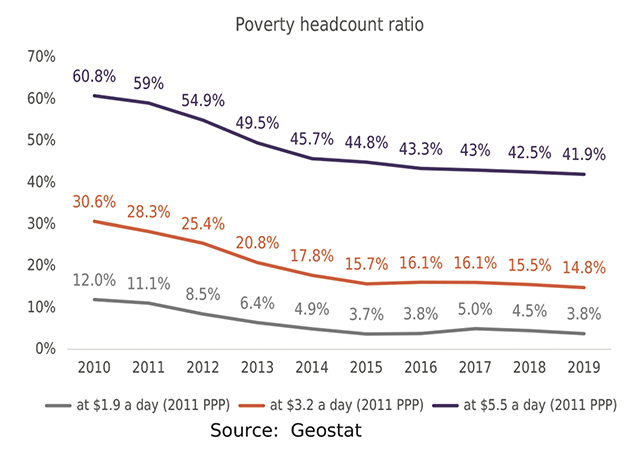
Poverty headcount ratio
An observation of the international poverty lines is informative when taking a closer look at the low-income proportion of society. Specifically, the international poverty lines show the percentage of a country’s population living below $1.9, $3.2, and $5.5 a day. Over the last decade, the proportion of the population living below the international poverty lines decreased significantly. Nevertheless, in 2019, 41.9% of the population was still living below the poverty line.
From 2010 to 2019, the share of the population living below the poverty line of $1.9 a day shrank from 12% to 3.8%. Meanwhile, the share of the population with a daily income below $3.2 shrank from 30.6% to 14.8%. In addition, the share of the population living below the poverty line of $5.5 a day shrank from 60.8% to 41.9%, The decline in the proportion of the population living below these poverty lines was more noticeable from 2010 to 2015. in 2016-2019, a waning decrease is partly attributed to the changes in foreign currency as the indicator is measured in USD.
The increase in household income over the last decade in Georgia might be attributable to positive developments in the labor market. From 2010 to 2020, the employment rate increased from 37.5% to 41.1%, and the unemployment rate decreased from 27.2% to 18.5%. Unsurprisingly, the overall increase in household income in Georgia had an impact on poverty.
Share of population receiving allowances, population living under absolute and relative poverty lines (2010-2020)
From 2010 to 2020, in Georgia, the share of the population under the absolute poverty line5 shrank from 37% to 21%. It decreased by 15 pp from 2010 to 2015, after which it underwent some fluctuation. It should be mentioned that in 2020, due to the COVID-19 crisis, those living below the absolute poverty line increased by 1.8 pp. Rural areas of the country have been more vulnerable to the crisis as the rate has grown by 3.8 pp, whereas in urban areas growth amounted to 0.7 pp. On the contrary, the share of the population living under the relative poverty line6 did not mirror changes in the absolute poverty line and remained steady.
Despite the decrease in the share of the population living under the absolute poverty line over the last decade, the proportion of the population receiving allowances did not drop. It increased from 11.4% in 2010 to 13% in 2020. Due to the COVID-19 crisis, by August 2021, the population receiving an allowance increased to 16.7%.
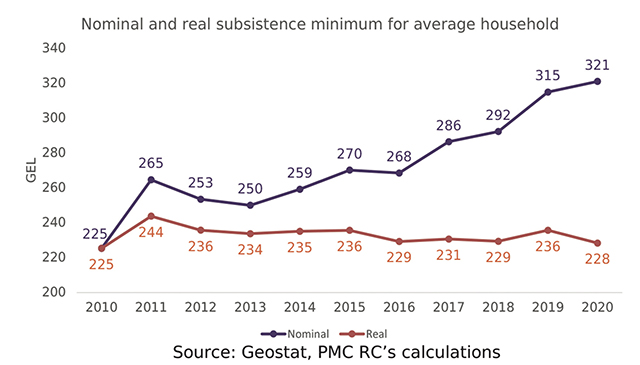
Nominal and real subsistence minimum for the average household
Another important indicator in the measurement of poverty is the subsistence minimum, as this is used to determine the absolute poverty line. The subsistence minimum for the average household indicates the amount of money that a family needs to meet the necessary needs in Georgia.
Between 2010 and 2020, the nominal annual subsistence minimum for the average household tended to increase in Georgia, with the exceptions of 2012, 2013, and 2016, where decreases were recorded. In the covered period, the nominal subsistence minimum for the average household increased from 225 GEL to 321 GEL (by 96 GEL). However, the general increase of the subsistence minimum over the last decade was strongly determined by the high rate of inflation, and real figures did not change noticeably.
There is one aspect of the calculation of the subsistence minimum that may encumber the accurate definition of the absolute poverty line. Specifically, Geostat defines the amount of money for buying food that provides an average family with the necessary amount of calories as 70% of the total subsistence minimum, with the remaining 30% used for non-food expenses. However, based on Geostat’s own data, in 2020 in Georgia, cash expenditure on food, beverages, and tobacco for the average family came to 54% of the necessary cost7 (food, beverages, and tobacco, transportation, utility bills, and healthcare).
Therefore, the set proportion for non-food expenses should in reality be at least 46%. When recalculating the average household’s subsistence minimum for 2020 and applying the more realistic 54%/46% ratio, it stands at 416 GEL, which is 95 GEL higher than that announced by Geostat.

Overall, due to the increase in real income in the period of 2010-2015, the proportion of the population living under the absolute poverty line decreased, however, from 2015, real income figures started to stagnate and the absolute poverty line has not changed noticeably. Furthermore, to identify more accurate figures of absolute poverty, the method of calculation of subsistence minimum could be reviewed.
1. https://www.ndi.org/sites/default/files/NDI%20Georgia_December%202020%20Poll_ENG_FINAL.pdf
2.Human Capital Index measures country’s score form 0-1, where 1 means maximal usage of human capital and 0 minimal. https://datacatalog.worldbank.org/dataset/human-capital-index
3. https://blogs.worldbank.org/opendata/new-world-bank-country-classifications-income-level-2021-2022
4. https://www.worldbank.org/en/news/press-release/2020/09/16/georgia-needs-more-investment-in-human-capital-to-assure-the-well-being-of-its-future-generations
5. Absolute poverty illustrates the proportion of society that has income below the subsistence minimum. https://www.geostat.ge/media/29277/0702_050220_EN.pdf
6. Relative poverty-measured by the relative rate of distribution of all income or expenditure https://www.geostat.ge/media/29277/0702_050220_EN.pdf
7. Necessary costs are defined by PMC RC
![]()
Main image source: georgianjournal


